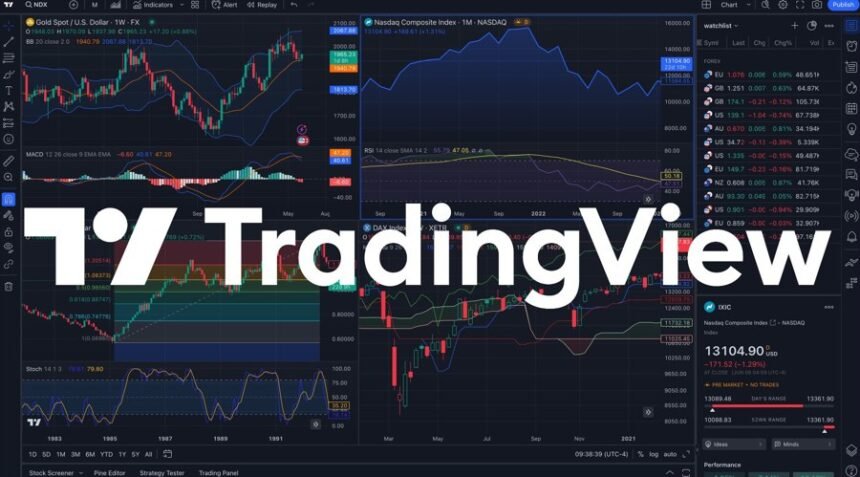
With thousands of indicators available, it is easy to get overwhelmed. One minute you are testing moving averages, the next you are buried in oscillators, trend tools, and strange acronyms you barely recognize. If you are using TradingView, you already know it offers an incredible library of built-in and community-created indicators. The real question is not how many tools you can apply, but which ones genuinely add value to your trading.
Start with the Fundamentals
Before diving into custom scripts and niche tools, it helps to master the classics. Indicators like RSI, MACD, and moving averages have stood the test of time for a reason. They offer clear signals and are easy to understand, especially for traders still building their foundation.
On TradingView, these indicators can be customized in detail. You can tweak inputs, change visuals, and even combine them into your own custom study. RSI, for example, is great for spotting overbought or oversold zones, while MACD helps highlight momentum shifts and potential trend changes.
Volume-Based Tools for Extra Clarity
Price tells part of the story, but volume confirms it. That is why volume-based indicators deserve a spot on your radar. Tools like the Volume Profile, On-Balance Volume, and VWAP help you understand where the big players are active and whether a move is likely to continue.
TradingView makes working with volume indicators simple. You can add a volume indicator beneath your chart or layer it directly onto the price action. This lets you see whether a breakout is backed by strong participation or simply drifting on low activity.
Trend Strength and Direction Indicators
For traders who follow momentum, indicators like ADX and the Supertrend can provide valuable insights. The Average Directional Index (ADX) shows how strong a trend is, which can help you avoid choppy or sideways markets. The Supertrend overlays directly on price, offering clear buy and sell signals based on volatility and trend shifts.
These tools are particularly helpful in fast-moving markets like crypto or forex. TradingView gives you access to countless variations of these indicators, including community-built versions with enhanced features. You can experiment with different styles until you find one that complements your approach.
Hidden Gems in the Public Library
Beyond the built-in tools, TradingView hosts a massive public library of user-created indicators. Some of these scripts combine popular tools in creative ways, while others offer completely new approaches. For example, you might find an indicator that blends Bollinger Bands with RSI, or one that tracks market sentiment based on social media or volume anomalies.
Not every script will work for your style, but exploring this library is a great way to discover fresh perspectives. Look for indicators with strong user feedback and clear documentation. Testing them in replay mode can help you decide whether they improve your strategy or create unnecessary noise.
Avoid Overloading Your Chart
With all the tools available, it can be tempting to stack indicator after indicator, hoping for a perfect signal. This usually leads to confusion instead of clarity. Some of the best traders keep their charts simple, focusing on two or three indicators that complement each other.
TradingView makes it easy to experiment while maintaining a clean layout. You can save different indicator templates and switch between them with one click. This lets you adapt to different market conditions without cluttering your screen or overwhelming your thought process.
The right indicators do not just tell you when to enter or exit. They help you understand what the market is doing and why. With the tools available on TradingView, you can build a smarter, more informed strategy tailored to your goals. Start with the basics, explore the community library, and most importantly, keep your setup aligned with how you actually trade.


